Room Timeline
State changes and root-cause context
GridRabbit Platform
The GridRabbit Platform gives building teams a real-time operating layer for room status, smart devices, floor plans, charts, 3DView, network health, mobile workflows, presets, rules, and maintenance replacement.
The GridRabbit Platform gives building teams a real-time operating layer for room status, smart devices, floor plans, charts, 3DView, network health, mobile workflows, presets, rules, and maintenance replacement.
Live status model
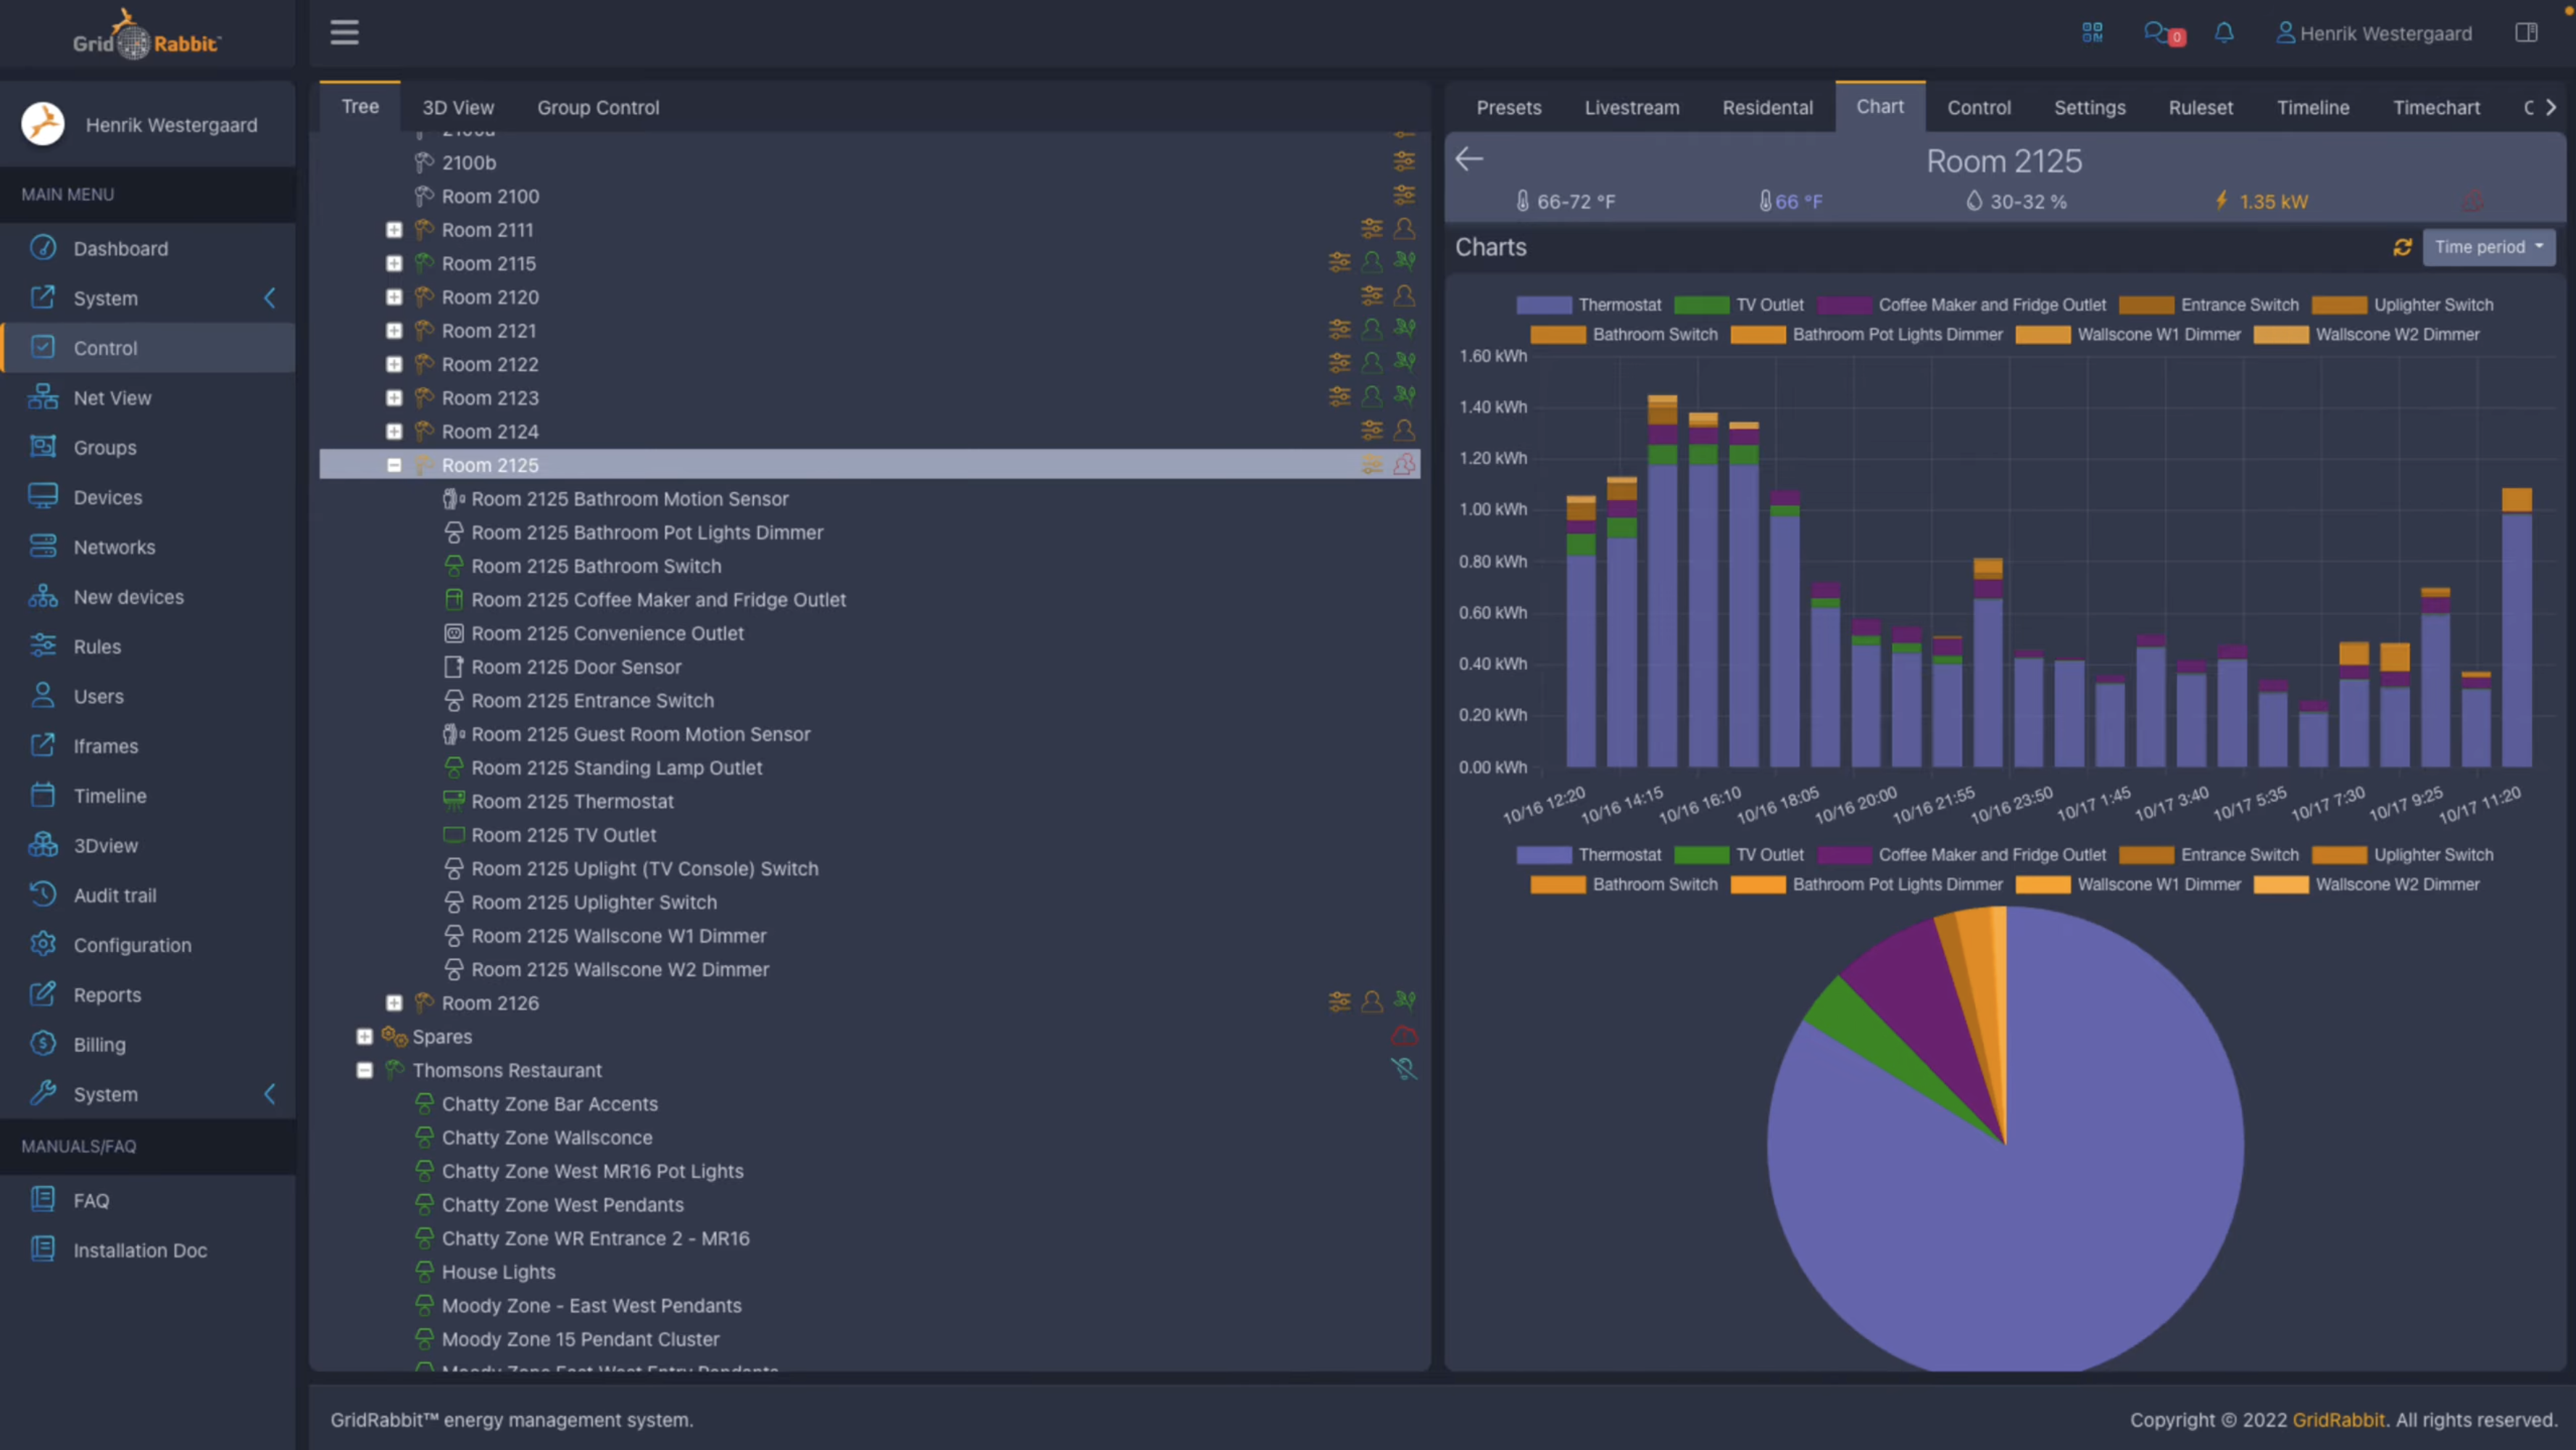
GridRabbit uses the same icon language and live state model across desktop and mobile views. Operators can move from a building overview to a floor, group, room, thermostat, outlet, sensor, network, or rule without losing context.
Scan floors, rooms, groups, and device states in one view, with filters for occupancy, service status, sensor state, and equipment alerts.
Room and device icons identify motion, open doors or windows, low battery, bad bulbs, filters, occupied rooms, recently vacated rooms, sold and ready rooms, DnD/MuR, and connectivity issues.
Use floor and group views to find rooms with active rules, sensor triggers, offline devices, long-running HVAC, DnD/MuR state, or energy efficiency opportunities.
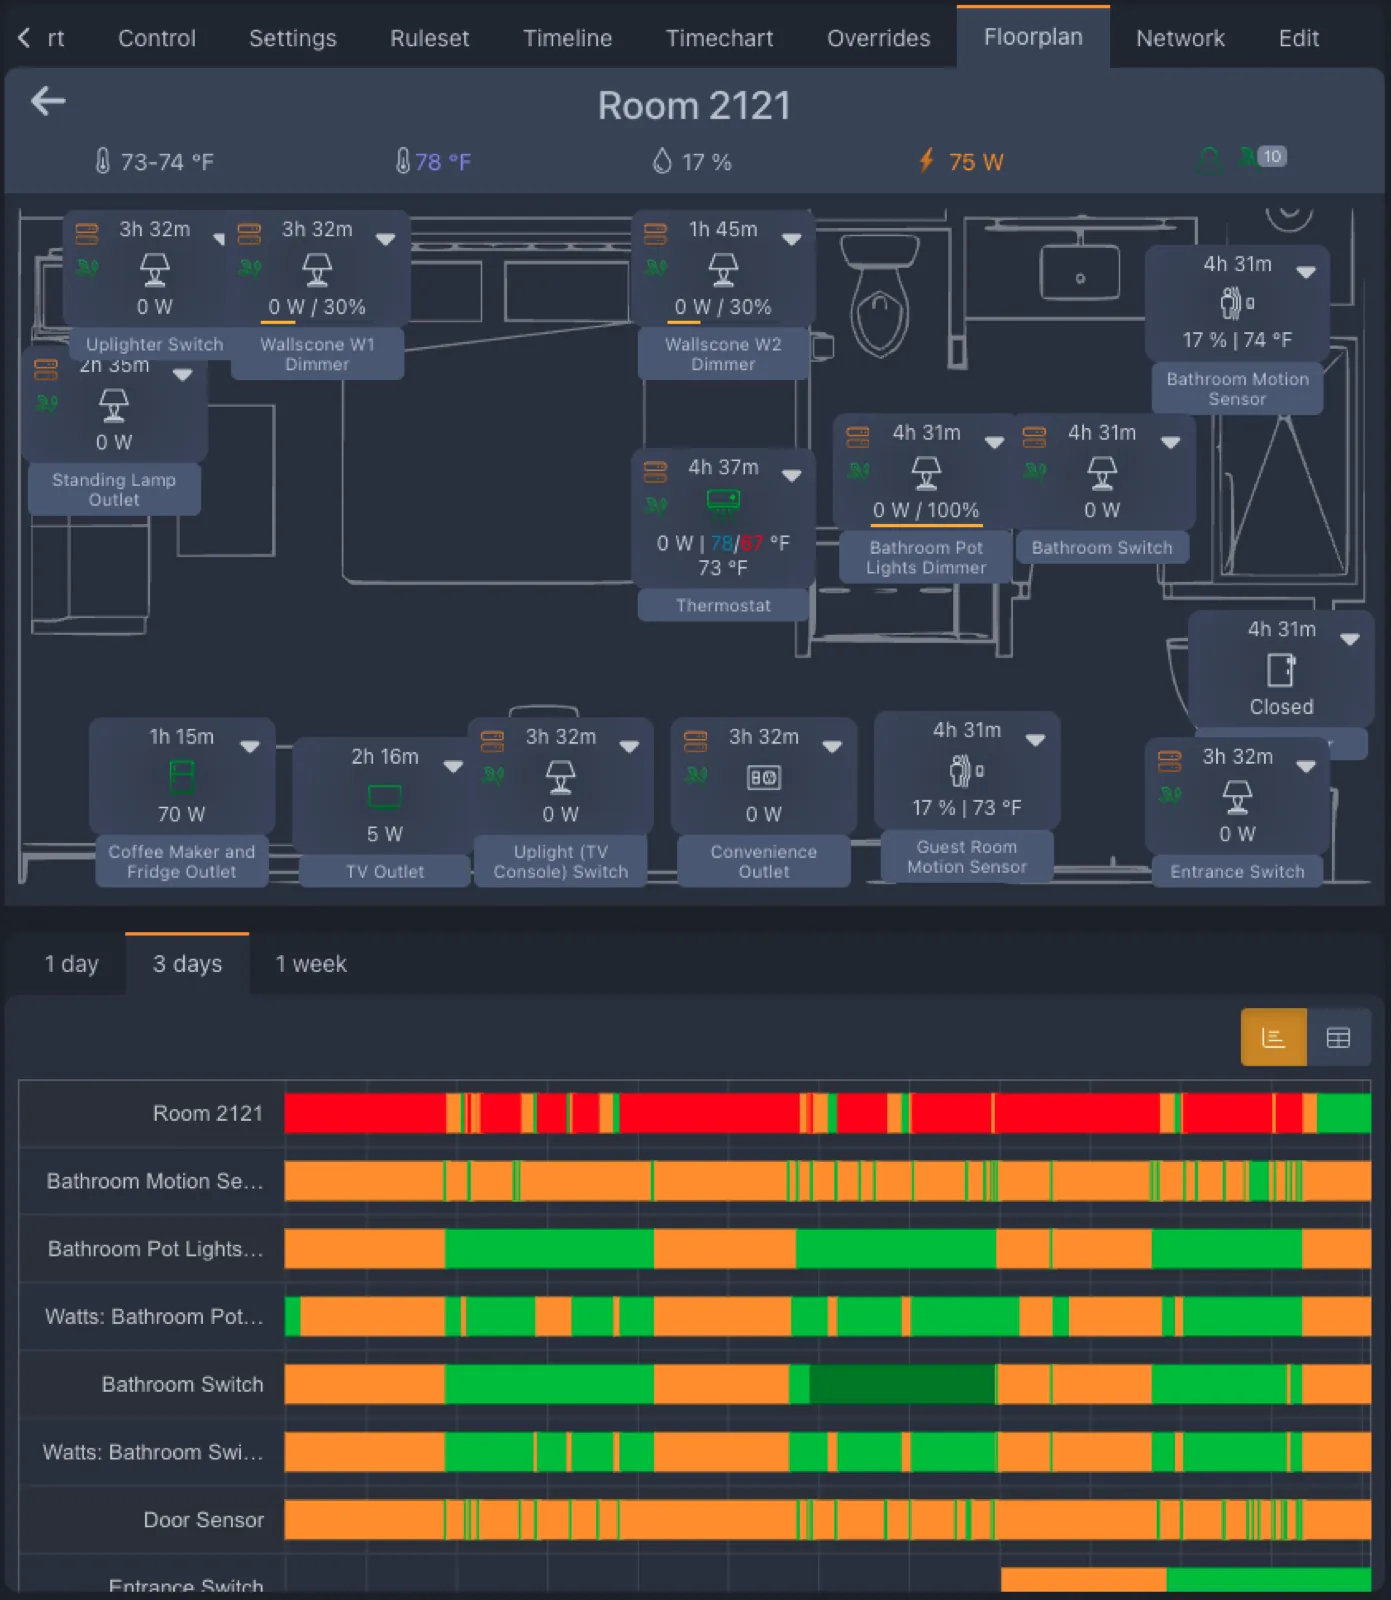
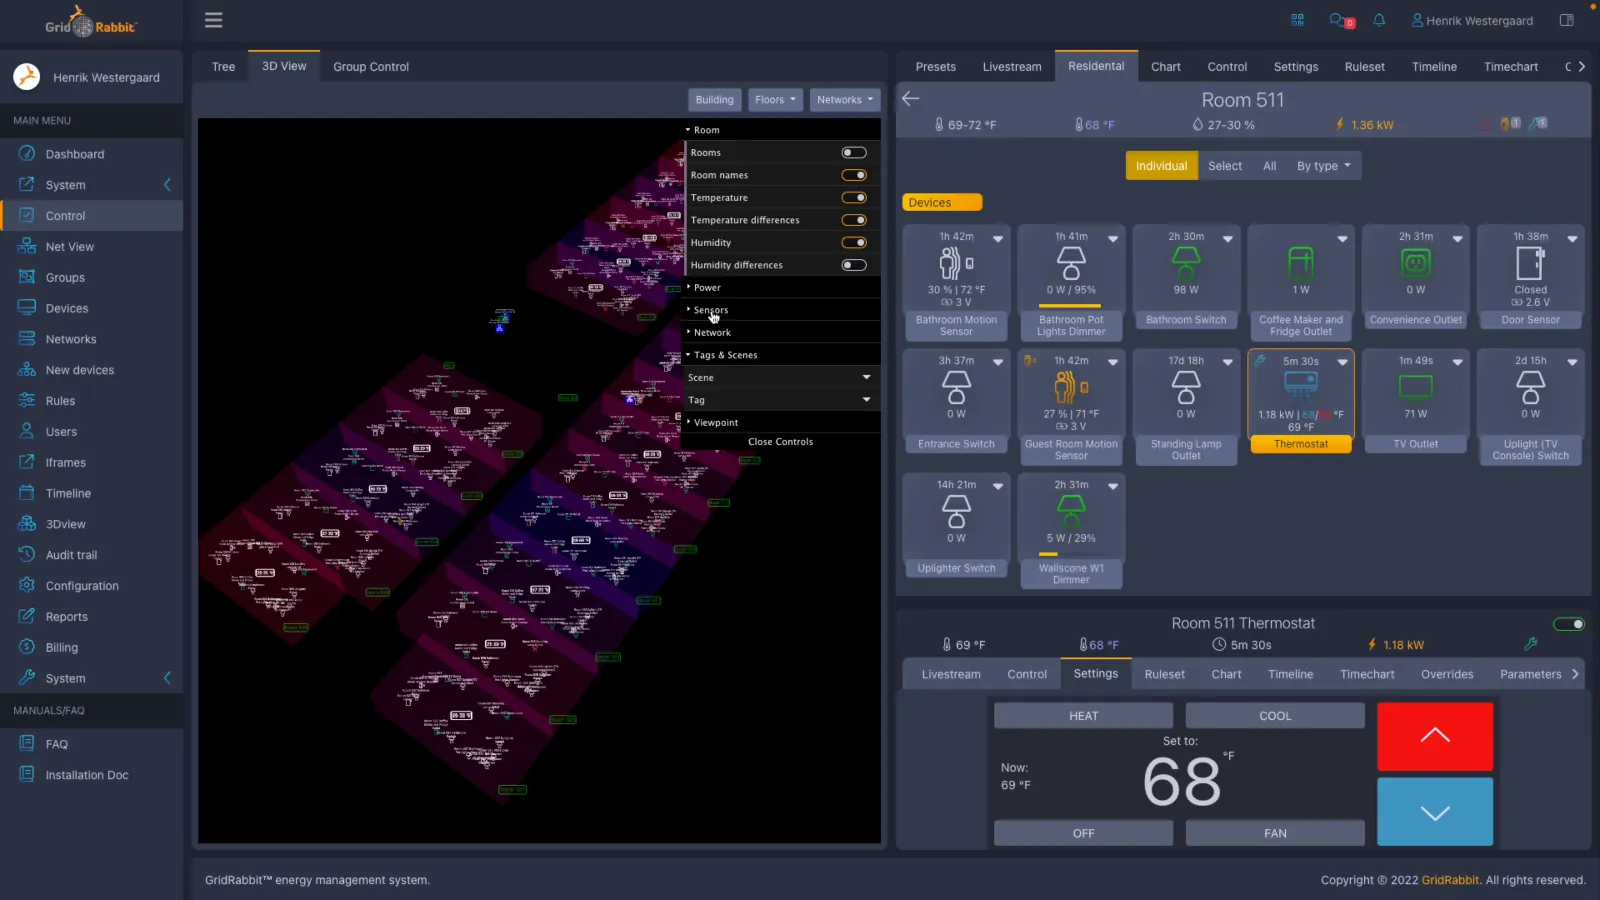
Room views show thermostat mode, temperature, humidity, motion, door state, light levels, outlet power, dimming percentage, and how long each device has been in its current state.
Room workflows
The UI connects live room control with history. Teams can see where devices are placed, review occupancy and sensor changes, compare thermostat setpoints against temperature, and confirm whether manual, remote, or rules-based actions occurred.
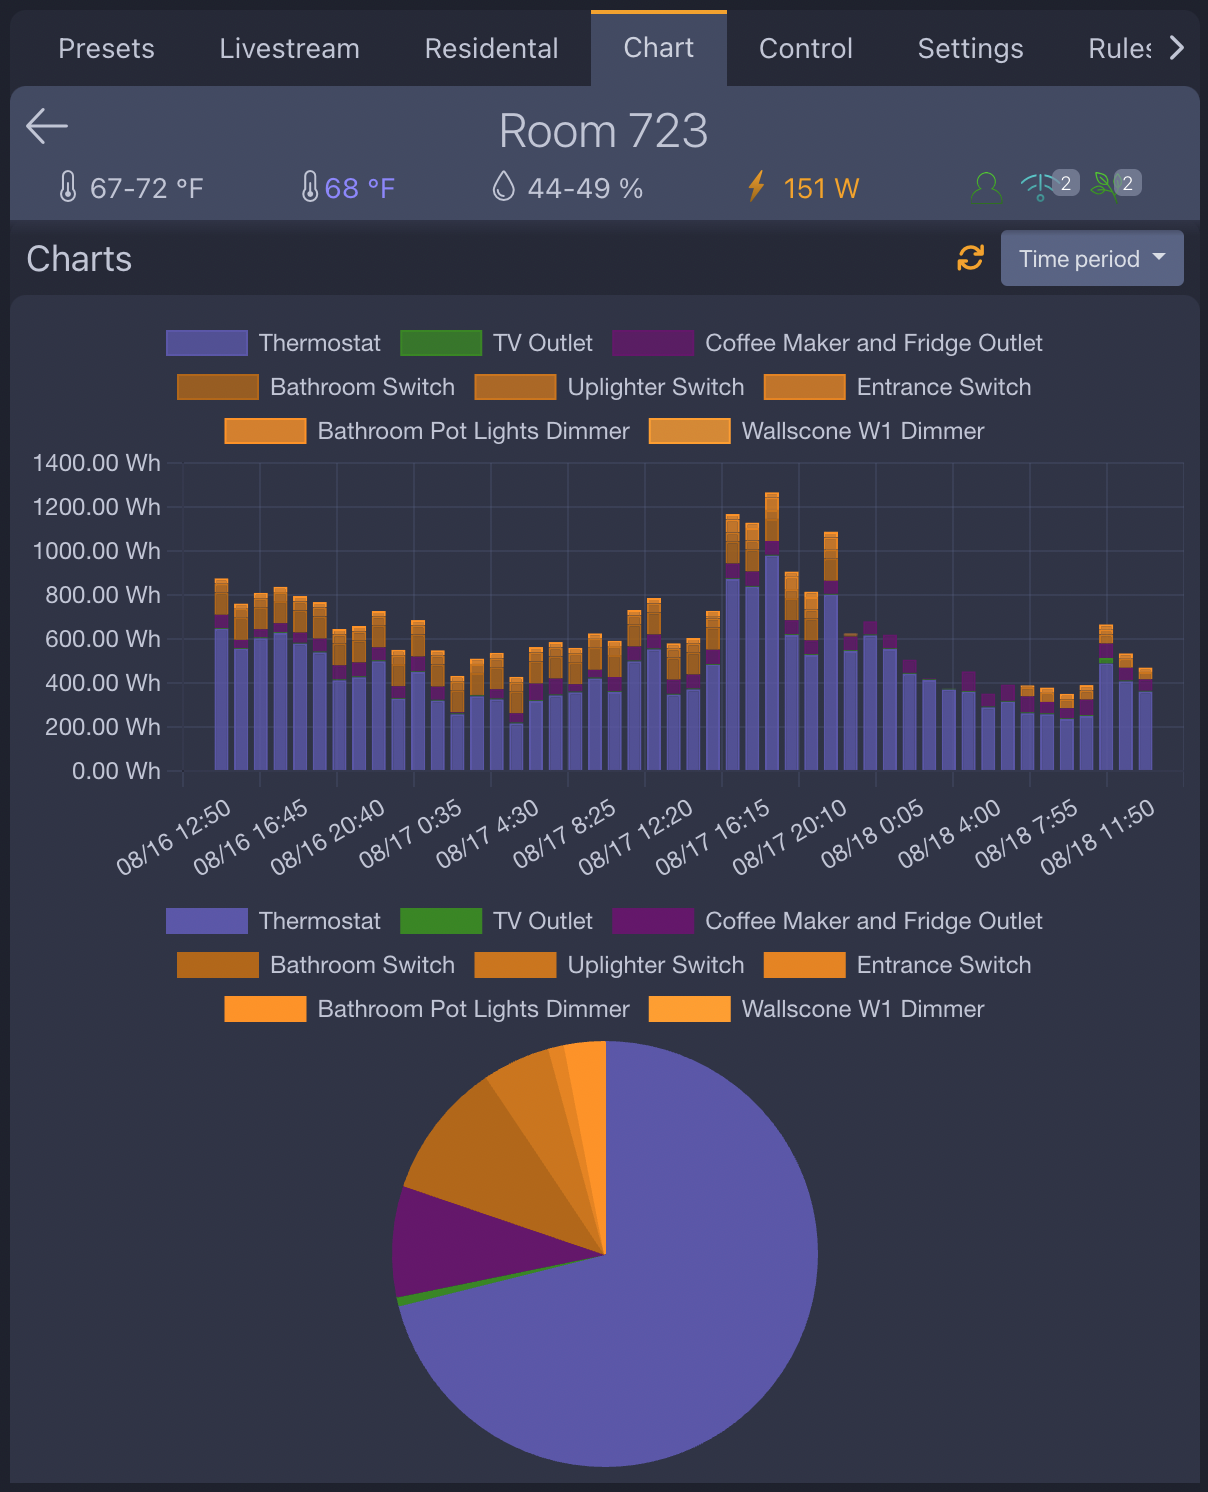
See how GridRabbit visualizes real-time guestroom energy usage—from HVAC compressor activity triggered by temperature changes to device-level consumption across lights, TV, refrigerator, and more—helping teams verify performance and detect issues early.
Compare compressor runtime, power, room temperature, cooling setpoint, and heating setpoint to catch comfort and energy issues early.
This view shows three days of occupancy on the 5th floor. Red indicates occupied rooms, green indicates empty rooms, and orange marks the 30-minute post-departure hold while GridRabbit confirms vacancy using the sequence of events between motion and door sensors.
View every room on one floor in a single map, with occupied rooms, recently vacant rooms, vacant rooms, rental status, door and motion activity, and maintenance alerts in the same view.
Floor-plan views pair actual device placement with time history, making it easier to diagnose occupancy, lights, sensors, HVAC, and service activity.
Charts can be opened from a building, group, floor, room, thermostat, outlet, or sensor to compare power, runtime, temperature, and activity.
Mobile app
The smartphone views bring building, floor, room, device, and control workflows into the field. Staff can check room state, adjust thermostat settings, view device status, and support maintenance workflows without returning to a desktop.
Scan building status and floor-level conditions from a phone.
Inspect groups, rooms, and devices while moving through the property.
See current room devices, values, battery state, and control points.
Adjust fan speed, temperature spans, and live settings from the phone UI.
Network and 3DView
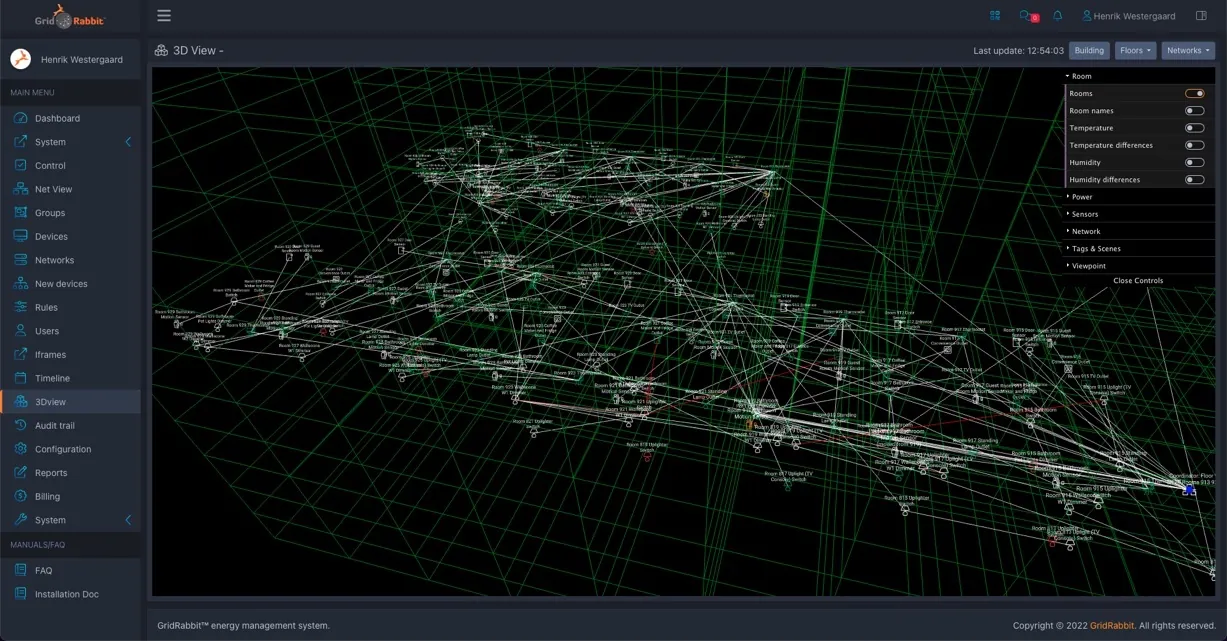
GridRabbit network tools show wireless communication paths, coordinator relationships, LQI, RSSI, and gateway status. The 3D view adds spatial context so teams can evaluate antenna placement and weak points during deployment.
GridRabbit 3DView shows wireless connections as they change in real time. During deployment, teams can identify weak points, evaluate antenna placement, and overlay sensor data on the building model.
See rooms, devices, coordinators, and live mesh paths together in the building model.
List views expose communication paths, link quality, signal strength, and status for faster network diagnostics.
Move from building context into floors and rooms while keeping live room state and device overlays visible.
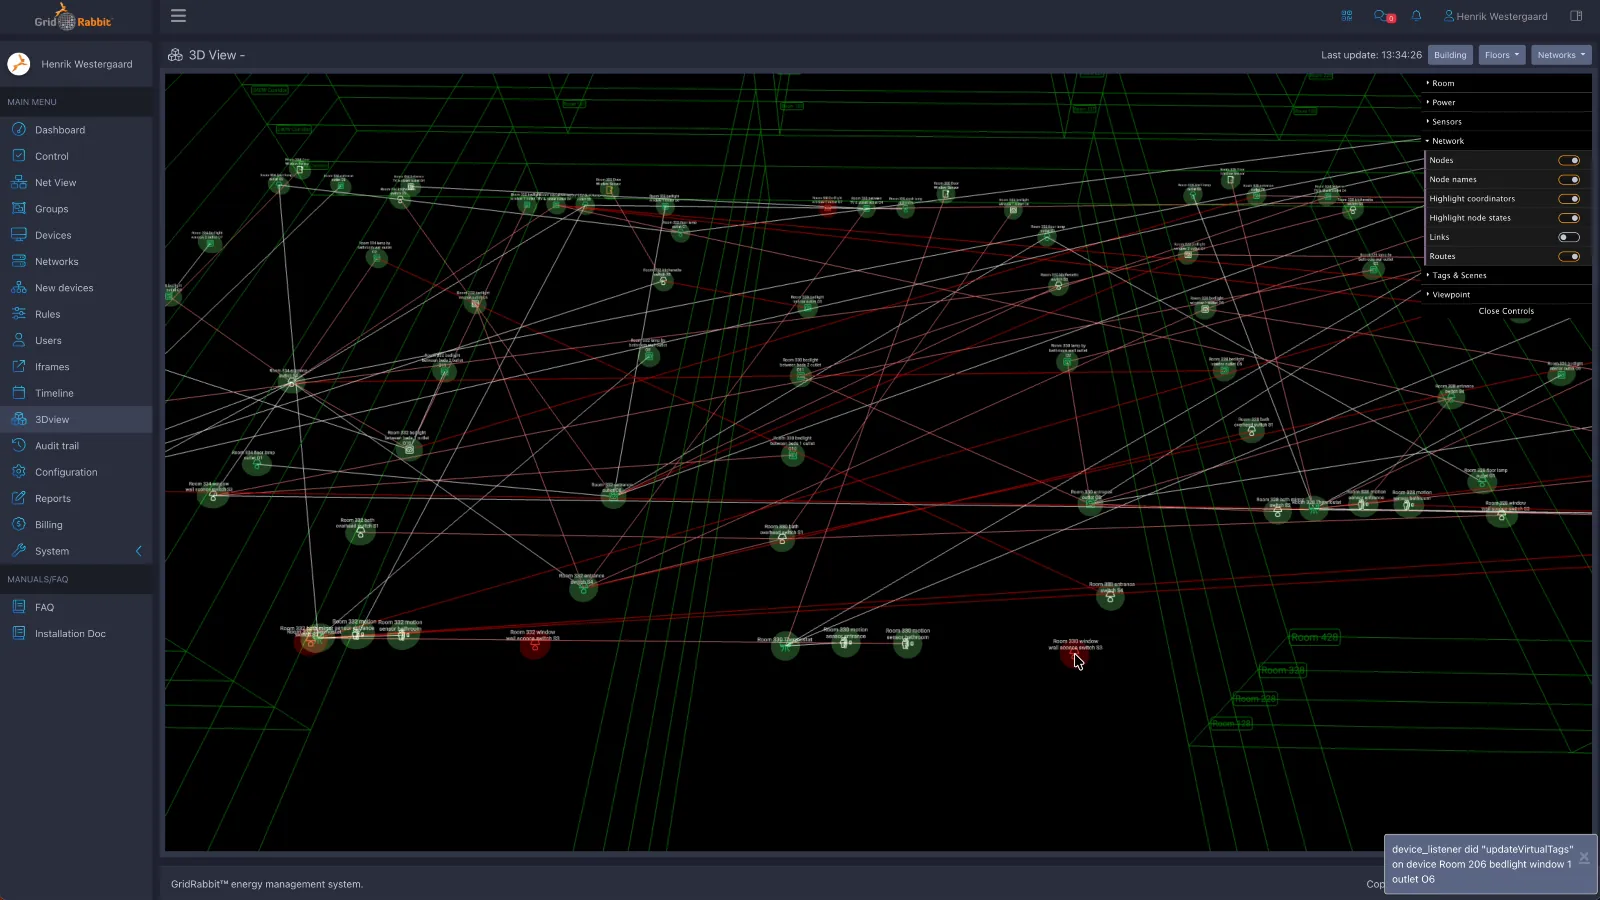
Watch mesh links and coordinator relationships change over the 3D model as the network view updates.
It is easy to make changes to the building floor plan in the floorplan editor by drag and drop. Teams typically use this after renovations, including when one suite is converted into two or more rooms.
From one screen, teams can move from a complete 3D building overview with device placement and status down to an individual room and device graph, like this thermostat performance example in room 331.
Controls, presets, and rules
Presets and rules help teams move beyond manual control. Schedules, group commands, device state triggers, and generated controls can coordinate lighting, thermostats, outlets, sensors, and guest-facing services.
Timed or manually triggered presets can coordinate device behavior across rooms, groups, restaurants, and shared spaces.
Operating teams can schedule lighting or device actions, then keep the same command model available for manual override.
Automation rules can expose editable controls, making scripts easier to operate without asking staff to edit code.

Walk through room, floor, device, chart, and control workflows using the same live status model.
Maintenance workflow
When a room device needs replacement, the mobile app can scan the QR code so the replacement inherits the previous device name, room, location, and settings. That keeps field work aligned with the live platform model.
Review device identity, configuration, and assignment from mobile.
Use the phone camera to read the new device QR label during replacement.
Scan a replacement unit and carry forward the previous device context.
FAQ
The platform is built for engineering, operations, energy, and maintenance teams that need one live view across rooms, devices, floor plans, rules, charts, and network health.
Yes. Teams can control single devices, room-level groups, floors, and filtered sets while keeping the same live status model from high-level dashboards down to device detail.
Yes. GridRabbit provides mobile views for building, floor, room, and device workflows so staff can inspect live state, make changes, and support maintenance work without returning to a desktop.
When a device is replaced, the mobile app can scan the new QR code so the replacement inherits the previous device identity, room assignment, and settings, which keeps field work aligned with the live software model.
Video Library
The GridRabbit YouTube page includes additional interface walkthroughs and product videos, so it is the best place to keep exploring the Platform beyond the examples shown here.
Browse more UI-focused videos covering workflows, controls, dashboards, and other product views that support the live software experience.
Contact
Share your building type, room/device scope, existing systems, and software workflow needs, and GridRabbit can map the right dashboard, mobile, and automation experience.